Many Shopify stores primarily measure superficial key figures. Values such as sessions, clicks, followers or impressions regularly appear in reports. At first glance, these figures seem impressive and convey a sense of growth. In reality, however, they say little about whether a company is actually scaling profitably.
Reach alone is not a strategy. A shop can double its number of visitors and become less profitable at the same time.
Sustainable growth in e-commerce is not the result of as many clicks as possible, but through a functioning combination of profitability, scalability and repurchases. This is exactly where a professional data strategy comes in.
A good data strategy clearly distinguishes between two types of key figures:
The difference between the two often determines whether a company can grow in a structured way or lose itself in marketing activities.
In the early phase of a Shopify store, many decisions can still be made relatively intuitively. Marketing budgets are small, the product range is manageable and the processes are relatively simple.
However, as soon as a company grows, the complexity of the entire organization also increases.
Without a clear KPI structure, structural problems quickly arise. Decisions are then made not on the basis of reliable data, but on the basis of gut feeling or isolated reports from individual teams.
A professional data strategy therefore does not simply mean installing an analytics tool or building a dashboard.
A data strategy is first and foremost a management structure, which determines which key figures are really relevant and how they are interpreted in the company.
In order to sustainably scale Shopify stores, it has been proven useful to divide key figures into several strategic levels. Each level answers a different key question in a company's growth.

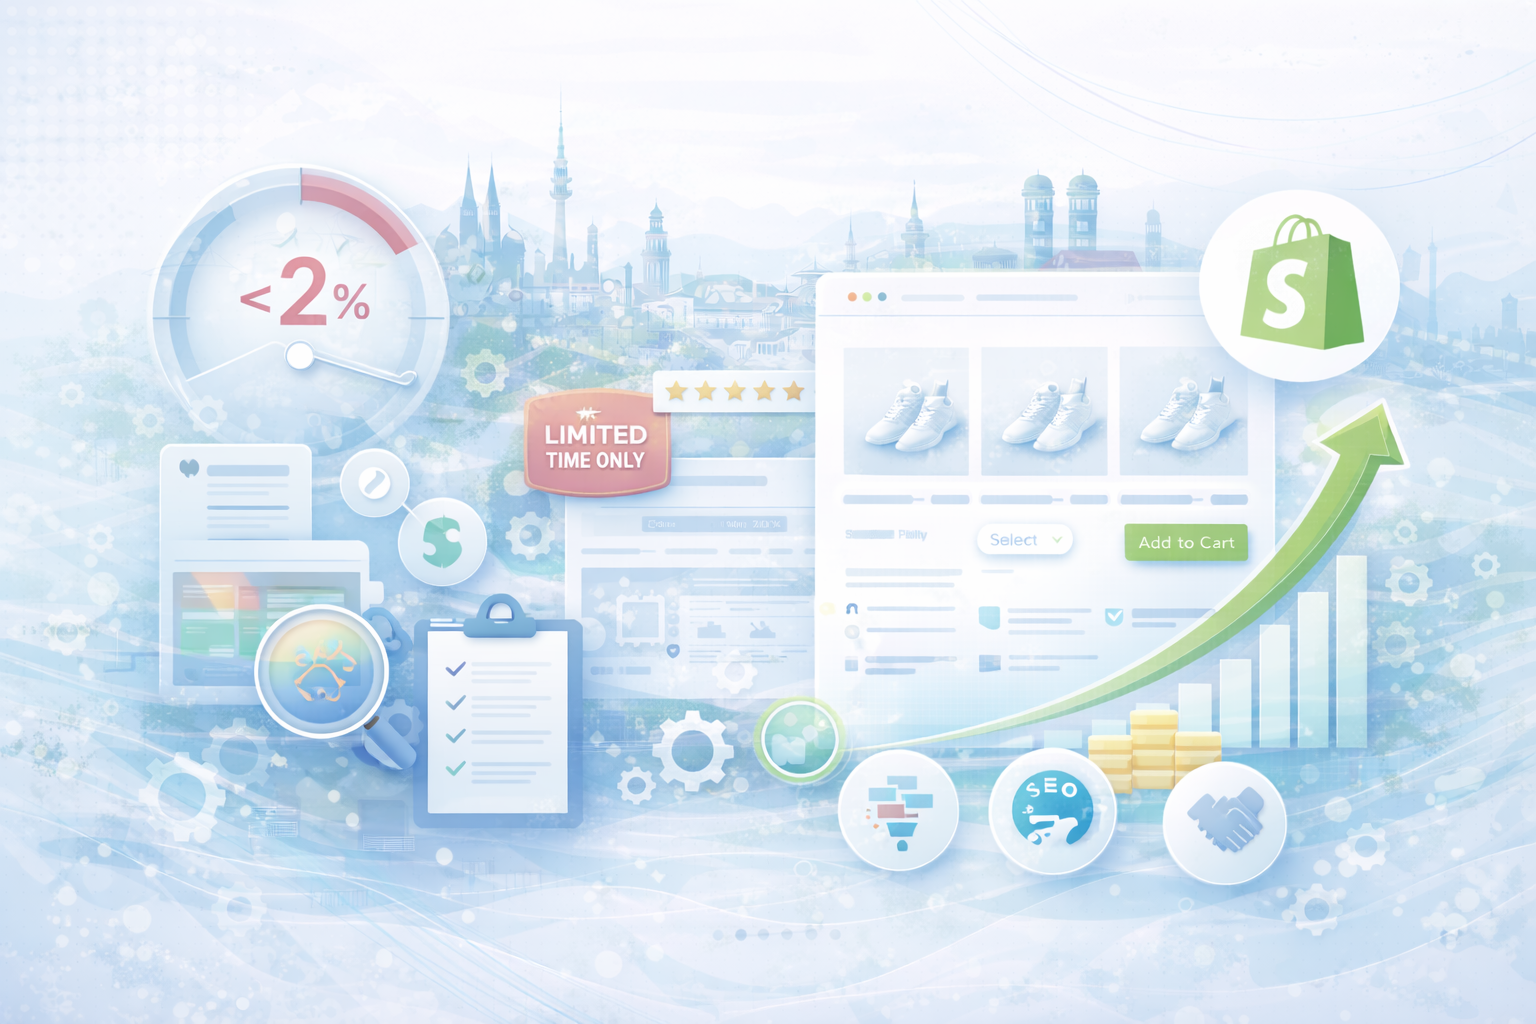
At the acquisition level, it is not about as much traffic as possible, but about the efficiency of customer acquisition.
Many shops focus exclusively on reach or number of clicks. However, the decisive factor is how expensive a new customer actually is and whether these costs pay off in the long term.
A scalable Shopify store knows its actual acquisition costs. This includes not only advertising costs, but also retargeting budgets, agency costs, tools, and internal resources.
It is only when these costs are fully taken into account that it is possible to assess whether growth is really profitable.
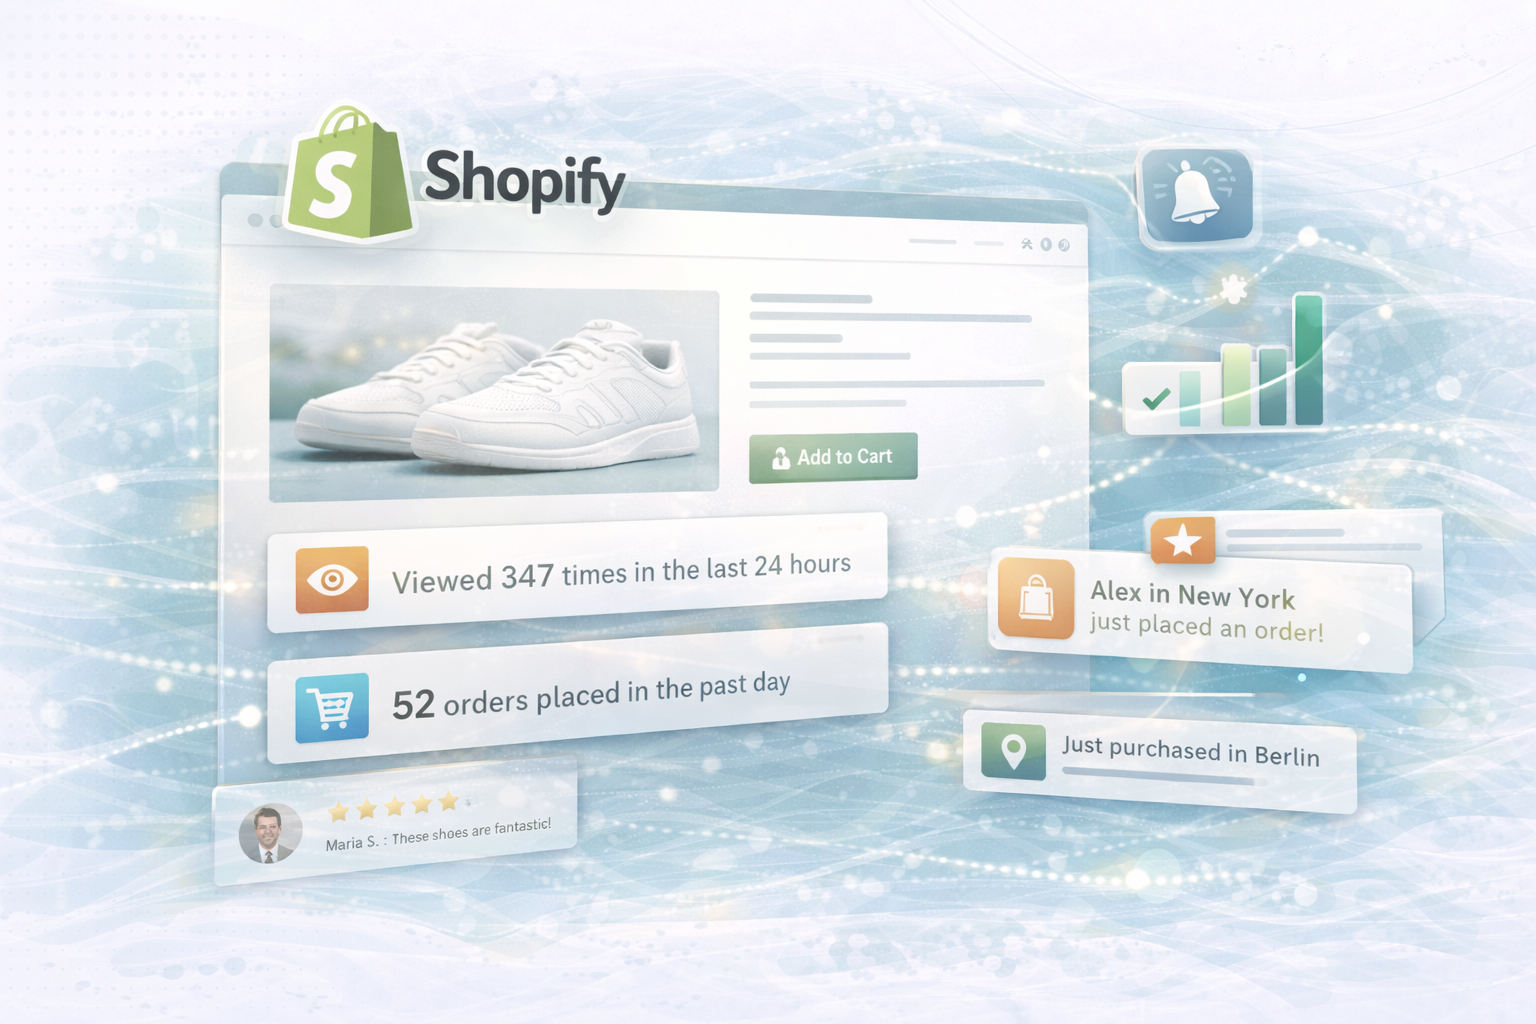
Traffic without conversion is one of the most expensive mistakes in e-commerce.
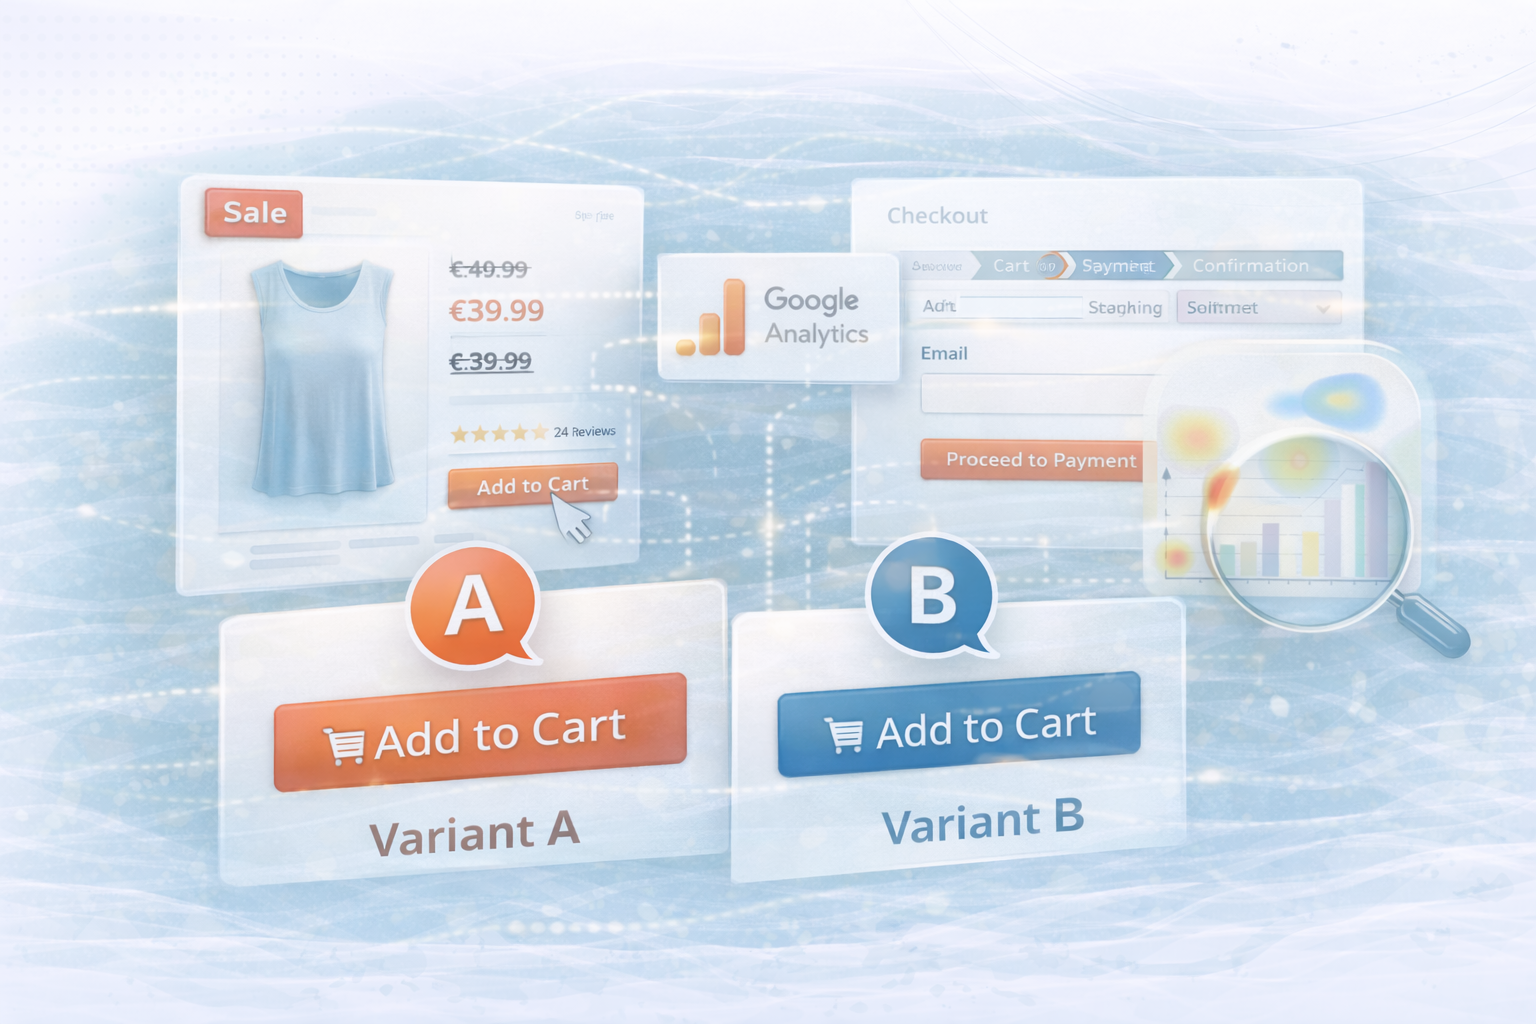
Many shops invest significant budgets in performance marketing without analyzing the actual performance of their shop experience. However, even small improvements in the conversion rate can have a huge impact on sales and profitability.
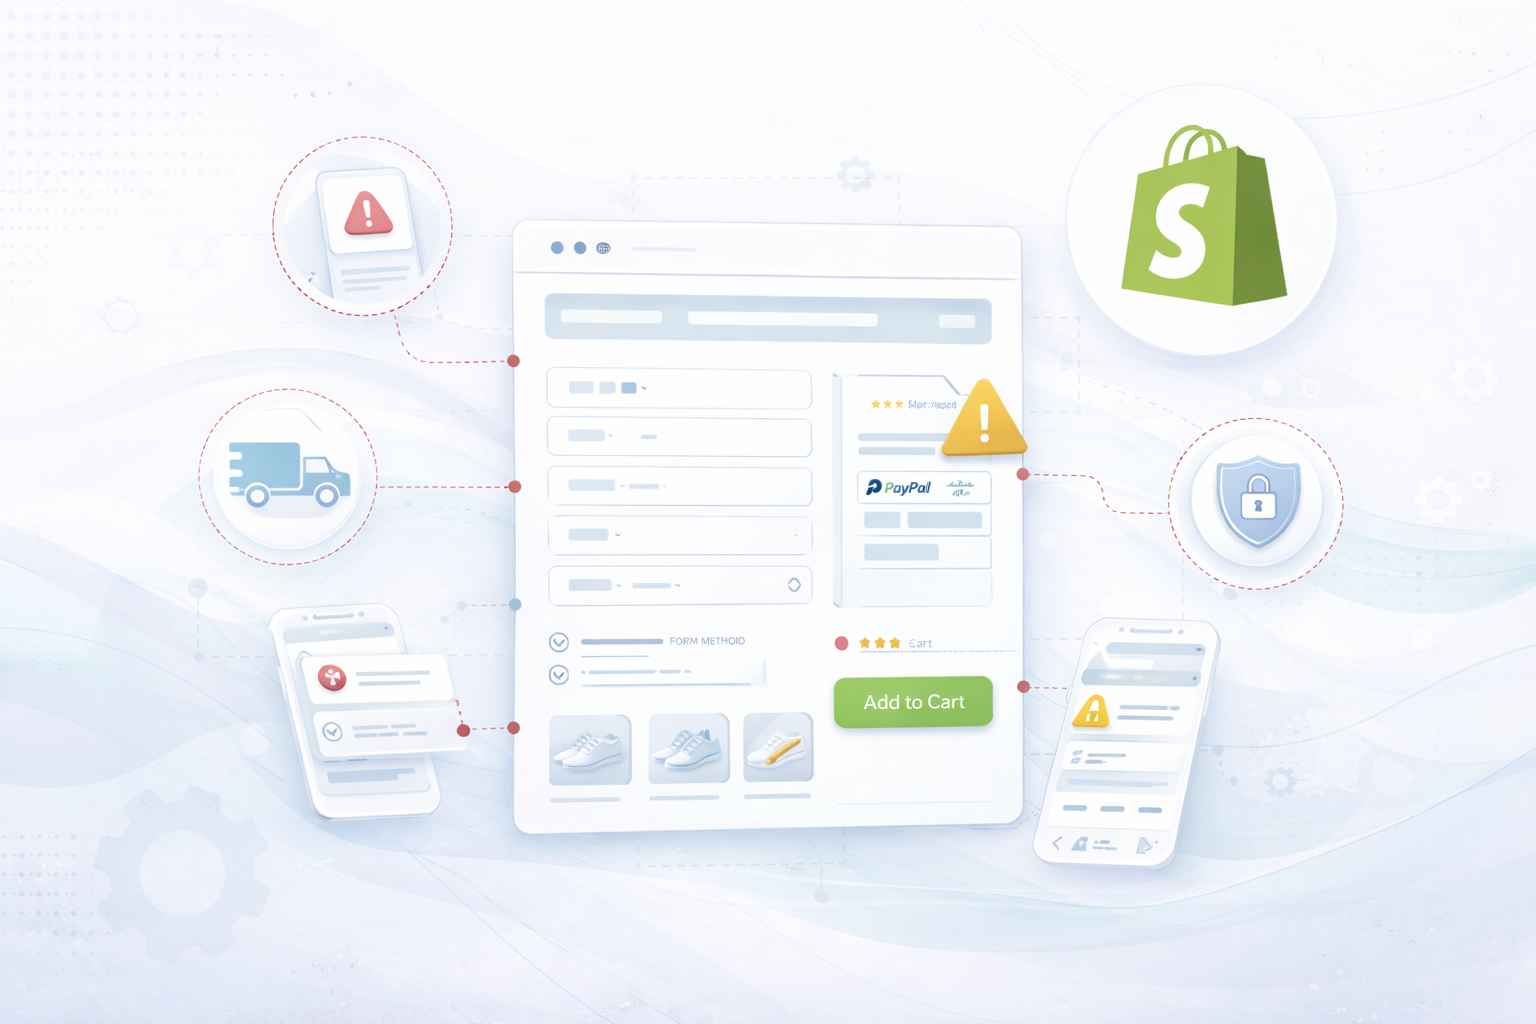
It is precisely at this level that the biggest growth levers often arise. Improvements in the checkout process, faster load times, or optimized product pages can significantly increase the efficiency of marketing budgets.
Many companies are heavily focused on revenue growth. However, turnover alone is not a reliable indicator of economic success.
It is not the turnover itself that is decisive, but the structure behind it. A shop can grow strongly and at the same time worsen its margins.
Turnover without margin is not sustainable growth. A clean revenue analysis shows which products are actually profitable and which only generate revenue.
The most profitable Shopify stores differ primarily in one key figure: their ability to retain customers over the long term.
Retention reduces reliance on paid traffic and ensures that marketing investments have a long-term effect.
Companies with a strong retention strategy can grow significantly more efficiently, as each new customer generates more revenue in the long term.
After a certain company size, the focus is increasingly shifting from growth to efficiency.
While sales growth is the main focus in early phases, operational indicators become decisive as the size increases.
This is where it is ultimately decided whether a company is actually scaling profitably or simply increasing its sales while the cost structure gets out of hand.
In many companies, different teams work with different key figures.
Marketing focuses on ROAS and campaign performance.
Finance focuses on margins and liquidity.
The e-commerce team optimizes conversion rates and shop experience.
These isolated perspectives often lead to conflicting goals.
Aggressive discount campaigns are a classic example. You can increase the conversion rate in the short term and make marketing campaigns appear more successful. At the same time, however, they can massively reduce the contribution margin.
Without a common KPI system, this results in decisions that make sense locally but damage the company as a whole.
A clean data strategy therefore links all KPI levels together.
For a data-based decision-making structure to work, a clear technical basis is required.
The most important point is that data is not just a dashboard.
Data is the basis for strategic decisions.

In early phases, many decisions can still be made relatively easily. As the size of the company grows, however, a structured KPI architecture is becoming increasingly important.
The bigger a company gets, the more important a clear KPI discipline becomes.
Not only do you want to generate more traffic, but your Shopify store Scale profitably?
We help you build a clear KPI architecture, define relevant key figures and develop a data-based decision structure for your company.
Get in touch
contact now